Decision tree from scratch
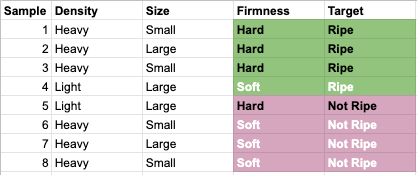
Decision trees are one of the most fundamental algorithms in machine learning. Let's review how to generate one from scratch. Consider the following table about three different attributes about the ripeness of a fruit. We have density, size, and firmness. Our target is "Ripe" or "Not Ripe".
| Sample | Density | Size | Firmness | Target |
|---|---|---|---|---|
| 1 | Heavy | Small | Hard | Ripe |
| 2 | Heavy | Large | Hard | Ripe |
| 3 | Heavy | Small | Hard | Ripe |
| 4 | Light | Large | Soft | Ripe |
| 5 | Light | Large | Hard | Not Ripe |
| 6 | Heavy | Small | Soft | Not Ripe |
| 7 | Heavy | Large | Soft | Not Ripe |
| 8 | Heavy | Small | Soft | Not Ripe |
Which attribute using maximum information gain would you choose as the root of the tree? To solve this problem, we need to perform three calculations:
- Calculate the entropy of the target
- Calculate the entropy of each attribute against the target
- Calculate the information gain of each attribute
- Select the attribute with the maximum information gain
Step 1 - To calculate the entropy of the target, we need to use this equation, where n is the number of classes in our target. For the sake of this blog post, we will substitute H(X) for the notation E(S), which is the entropy of the target attribute allowing us to calculate the entropy for the (S)et.

We can see that the Target variable has 4 instances of "Not Ripe" and 4 instances of "Ripe". Knowing this, we solve:
$$E(S) = - (4/8)log_2(4/8) - (4/8) \log_2(4/8) = 1.0$$
(Recall that log_2(0.5) = 1.0)
Step 2 - To calculate the entropy of each attribute takes a little more work, by hand. It's the same idea, but now we use a frequency table.
Density:
| Target | ||||
|---|---|---|---|---|
| Ripe | Not Ripe | Total | ||
| Density | Heavy | 3 | 3 | 6 |
| Light | 1 | 1 | 2 | |
| 8 |
We count up the number of samples for the positive (Ripe) and negative (Not Ripe) classes. By doing this we can visualize it in a table, which I find helpful.
$$E(Density, Target) = (6/8)*E(3,3) + (2/8)*E(1,1)$$
Here we show that there are 6 out 8 total Heavy samples and 2 out of 8 total Light samples. We then calculate the entropy, as we did with the target, taking into account the positive (Ripe) and negative (Not Ripe) samples which is what E(3,3) denotes for the Heavy samples and E(1,1) denotes for the Light samples. Solving we expand it like so:
$$= 0.75*(-0.5\log_2(0.5) - 0.5\log_2(0.5)) + 0.25*(-0.5\log_2(0.5) - 0.5\log_2(0.5))$$
= 0.75*(-0.5*1 - 0.5*1) + 0.25*(-0.5*1 - 0.5*1)
= 0.75(1) + 0.25(1) = 1.0
So, $$E(Density, Target) = 1.0$$
Size:
| Target | ||||
|---|---|---|---|---|
| Not Ripe | Ripe | Total | ||
| Size | Small | 2 | 2 | 4 |
| Large | 2 | 2 | 4 | |
| 8 |
$$E(Size, Target) = (4/8)*E(2,2) + (4/8)*E(2,2)$$
$$= 0.5*(-0.5\log_2(0.5) - 0.5\log_2(0.5)) + 0.5*(-0.5\log_2(0.5) - 0.5\log_2(0.5))$$
= 0.5*(-0.5*1 - 0.5*1) + 0.5*(-0.5*1 - 0.5*1)
= 0.5(1) + 0.5(1) = 1.0
So, $$E(Size, Target) = 1.0$$
Firmness:
| Target | ||||
|---|---|---|---|---|
| Ripe | Not Ripe | Total | ||
| Firmness | Hard | 3 | 1 | 4 |
| Soft | 1 | 3 | 4 | |
| 8 |
$$E(Firmness, Target) = (4/8)*E(3,1) + (4/8)*E(1,3)$$
$$= 0.5*((3/4)\log_2(3/4) - (1/4)\log_2(1/4)) + 0.5*((1/4)\log_2(1/4) - (3/4)\log_2(3/4))$$
= 0.5*0.811 + 0.5*0.811 = 0.811
$$E(Firmness, Target) = 0.811$$
Step 3 - Now we calculate the information gain, which measures the gain of information after having added the attribute. To do this, we can use this formula where X is one of the attribute (i.e. Density, Size, Firmness) and T is our Target.
$$Gain(X,T) = E(T) - E(X,T)$$
We know that E(T) = 1.0. For each attribute:
Gain(Density, T) = 1.0 - 1.0 = 0 (no information gain!)
Gain(Size, T) = 1.0 - 1.0 = 0 (again, no information gain)
Gain(Firmness, T) = 1.0 - 0.811 = 0.189
Step 4 - Select the attribute with the maximum information gain, assuming the tree we are constructing is an ID3 decision tree - a top-down, greedy search through the space of all possible branches with no backtracking. As the heuristic implies, we need to find the gain that has the maximum value. This is clearly the attribute "Firmness". Aha, now we can select this as our root node.
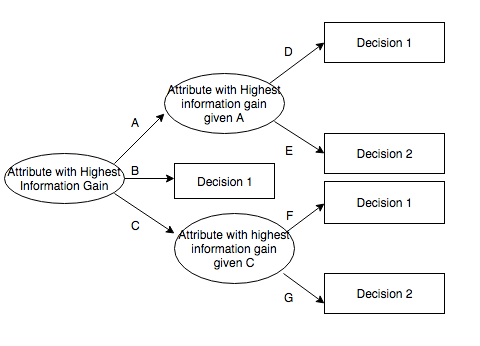
Show the entire decision tree that would be constructed by ID3 by recursively applying information gain to select the roots of sub-trees after the initial decision. Let's start by placing "Firmness" as the root node:
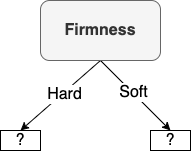
Each arc indicates the value for the attribute, so we have indicated "Hard" and "Soft". But we can see in our table that Firmness doesn't split the data into clean, separate classes. We have one negative sample ("Not Ripe") for "Hard", but 3 positive samples ("Ripe") for "Hard". For "Soft" we see 1 "Ripe" and 3 "Not Ripe"s. As a result, we cannot terminate since the attribute did not split the samples into subsets that are all positive or all negative. We have to keep going.
So how do we figure out what attribute to select for the next split? Well, we need to calculate the entropy again, but in a different way. Here's how I do it. For each subset, create a separate sub-table for that specific sub-attribute. In the below, we have a table of samples showing the Density and Size, only for samples where the Firmness = "Hard".
| Density | Size | Firmness = Hard |
|---|---|---|
| Heavy | Small | Hard |
| Heavy | Large | Hard |
| Heavy | Small | Hard |
| Light | Large | Hard |
Calculate the Entropy(Density) and Entropy(Size) using this sub-table. For Density we can see there are 3 Heavy samples and 1 Light sample (3,1). For Size there are 2 Small samples and 2 Large samples (2,2).
$$E(Density | Firmness = Hard) = E(3,1) = E((3/4), (1/4))$$
$$= -0.75*\log_2(0.75) - 0.25*\log_2(0.25) = 0.811$$
$$Gain(Density | Firmness = Hard, Target) = 1.0 - 0.811 = 0.189$$
$$E(Size) = E(2,2) = E(0.5, 0.5)$$
$$= -0.5*\log_2(0.5) - 0.5*\log_2(0.5) = 1.0$$
$$Gain(Size | Firmness = Hard, Target) = 1.0 - 1.0 = 0$$
Let's do it again for the subset of Firmness = Soft.
| Density | Size | Firmness = Soft |
|---|---|---|
| Light | Large | Soft |
| Heavy | Small | Soft |
| Heavy | Large | Soft |
| Heavy | Small | Soft |
There are 3 Heavy, 1 Light for Density (3,1), and 2 Small and 2 Large for Size (2,2). Without going any further, we can intuit that the calculations will be the same as for Density and Size when Firmness = Hard.
$$E(Density | Firmness = Soft, Target) = E(3,1) = 0.811$$
$$Gain(Density | Firmness = Soft, Target) = 1 - 0.811 = 0.189$$
$$E(Size | Firmness = Soft, Target) = E(2,2) = 1.0$$
$$Gain(Size | Firmness = Soft, Target) = 1.0 - 1.0 = 0$$
Completing the construction of the decision tree:
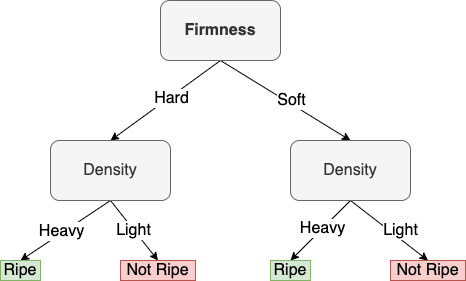
How would we classify two new examples using this decision tree?
| Sample | Density | Size | Firmness | Target |
|---|---|---|---|---|
| 9 | Light | Small | Hard | ? |
| 10 | Light | Small | Soft | ? |
Per our tree, both samples would be classified as "Not Ripe".
More references on ID3:
- Quinlan, J. Ross. "Induction of decision trees." Machine learning 1.1 (1986): 81-106. PDF
- https://www.cise.ufl.edu/~ddd/cap6635/Fall-97/Short-papers/2.htm
- http://saedsayad.com/decision_tree.htm
Thanks, and if you see any errors, please let me know.