Kibana Dashboard for Amazon Food Reviews

I recently had the privilege of competing with my company's team at the State of Virginia Datathon, a hackathon merging policy innovations as well as data science work to find ways to fight the opioid crisis in Virginia. One of the things aside from data cleaning that I was able to contribute, was setting up a few Kibana dashboards using publicly available data, as well as crime data the State of Virginia provided. The dashboards are here on Vimeo, but in this post, I'll walk you through how you can set up ElasticSearch to read in CSV files and create easy visualizations on Kibana.
Installation
I'm using a MacBook, so what I'll do is install via Homebrew. Make sure you have Homebrew installed on your Mac, first. This will install the latest version of the ELK stack. As of October 2017, it's Version 5.6.2.
brew install elasticsearch
brew install kibana
brew install logstash
At this point, the files have been installed automatically here:
/usr/local/Cellar/elasticsearch/5.6.2
/usr/local/Cellar/kibana/5.6.2
/usr/local/Cellar/logstash/5.6.2
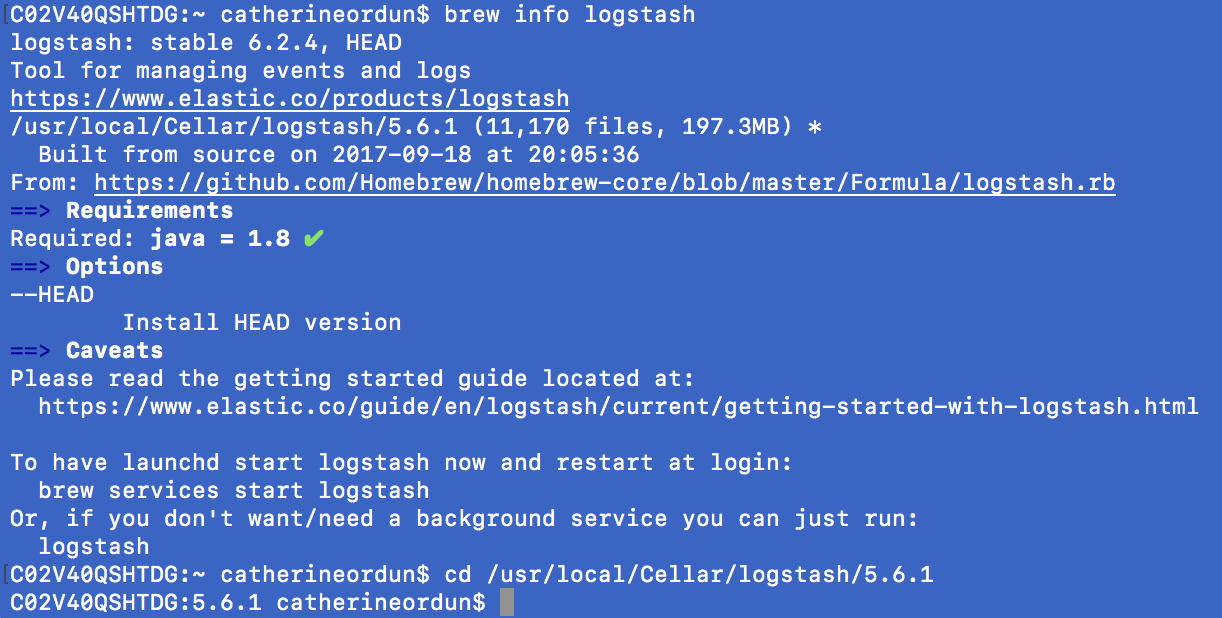
*Update: If you can't find the directory for your installation via brew, type in:
brew info elasticsearch
brew info kibana
brew info logstash
This should return the directory like follows:
Open up three tabs concurrently in Terminal, one for each application. We'll need to first, configure the logstash .config file for our Amazon Food Reviews csv before running logstash. To run elasticsearch, input the following in one tab:
elasticsearch
To run Kibana input the following in another tab:
kibana
At this point you should be able to see Kibana running at the local host specified in your Terminal. For me it was http://localhost:5601
Prepping the CSV File
You might recall from an older post on EDA for Amazon Food Reviews, Part I, that I downloaded the Amazon dataset from Kaggle here: https://www.kaggle.com/snap/amazon-fine-food-reviews.
Using that same CSV file entitled Reviews.csv, the first 10 records looked like this:
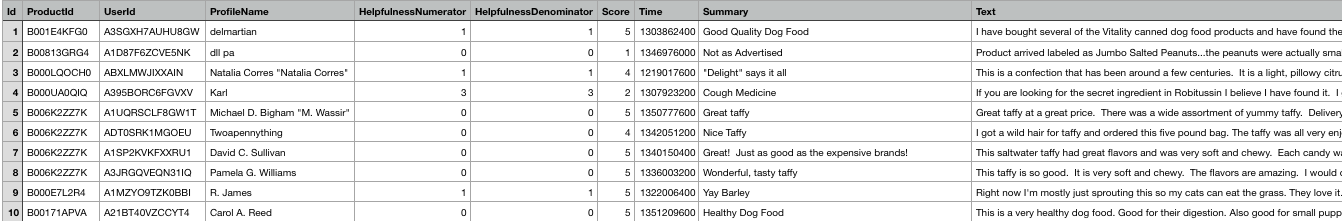
Where we have the following 10 columns that we'll load into ElasticSearch:
Id - Object
ProductId - object
UserId - object
ProfileName - object
HelpfulnessNumerator - int64
HelpfulnessDenominator - int64
Score - int64
Time - int64
Summary - object
Text - object

import pandas as pd
from bs4 import BeautifulSoup
import datetime

#clean text using bs4

data['text_cln']= data['Text'].map(lambda x: BeautifulSoup(x, "lxml").get_text())
I also thought it would be interesting to show Textblob's sentiment scores on Kibana, as well:
import textblob
from textblob import TextBlob

data['tb_polarity']= data['text_cln'].map(lambda x: TextBlob(x).sentiment.polarity)
Let's do a little cleaning to normalize the Time feature into a proper datetime var, also apply BeautifulSoup like the older post, to clean up the text. The Time stamp per this Kaggle discussion post indicates that this format is in Unix time:
"The timestamp is in Unix time, also known as epoch time. You can read about it here. In short it's the number of seconds since 1970-01-01 00:00:00 UTC time. In python you can use datetime.datetime.fromtimestamp to convert a Unix timestamp to a Python Datetime object."
#normalize date time
data2 = data.copy()

data2['datetime'] = data2['Time'].map(lambda x: (datetime.datetime.fromtimestamp(int(x)).strftime('%Y-%m-%d %H:%M:%S')))

data2['datetime'] = pd.to_datetime(data2['datetime'])
As a hack. I was experiencing problems with reading in a single column for Summary and text_cln because of all the commas within each column of text. So, to get the text read in properly so that the separator => ‘,’ didn’t parse every instance of commas, I went back into Python and added a quotation mark (“) at the front and end of each text string fortext_cln.
At this point, let's just create a final DataFrame with the columns of interest:
final_data = data2[['ProductId', 'UserId', 'ProfileName','HelpfulnessNumerator', 'HelpfulnessDenominator', 'Score', 'Summary', 'text_cln', 'tb_polarity', 'datetime']].copy()
Now I'll export the final_data DataFrame as a new csv with the formatted datetimes and text. You have to ensure that encoding is not ‘\t’ just default comma ‘,’ per the pandas.DataFrame.to_csv documentation: sep : character, default ‘,’ field delimiter for the output file. So do not specify separator in to_csv, just let it set to default.
final_data.to_csv("...data/final_data.csv", index_col = 0, encoding='utf-8')
There are a total of 568,454 records in this final DataFrame.
Getting started with the .config file into Logstash
I learned a lot from watching these two YouTube videos by Imtiaz Ahmad:
The .config file is the key script required for sending CSV data from your local machine through ElasticSearch and visualizable into Kibana.
input {
    file {
        path => "/Users/catherineordun/Documents/data/Kaggle/final_data.csv"
        start_position => "beginning"
        sincedb_path => "/dev/null"
    }
}

filter {
    csv {
        separator => ","

        columns => ["ProductId",
        "UserId",
        "ProfileName",
        "HelpfulnessNumerator",
        "HelpfulnessDenominator",
        "Score",
        "Summary",
        "text_cln",
        "datetime"]
    }

   date {
      match => ["datetime", "yyyy-MM-dd HH:mm:ss"]
      target => "datetime"
   }

   mutate {
        convert => {
           "HelpfulnessNumerator" => "integer"
           "HelpfulnessDenominator" => "integer"
           "Score" => "integer"
        }
    }
 }

output {
    elasticsearch {
    hosts => "localhost"
    index => "amazon"
    document_type => "review"
}

stdout {}

}
Breaking down the .config file
input is where we declare the path to where the CSV file lives. start_position, per the ElasticSearch documentation, indicates where "Logstash starts initially reading files. The default behavior treats files like live streams and thus starts at the end. If you have old data you want to import, set this to beginning."
The filter is what I've noticed is where a lot of the action happens. First, being a CSV file, the delimiter is a comma, so you need to set it to such under separator. Now, for each of the 10 columns (features) we prepared for the final_data CSV file, we need to list them under the columns setting, which can be a drag if you have a lot of columns. I bet there's a script out there that declares all this automatically into a template.
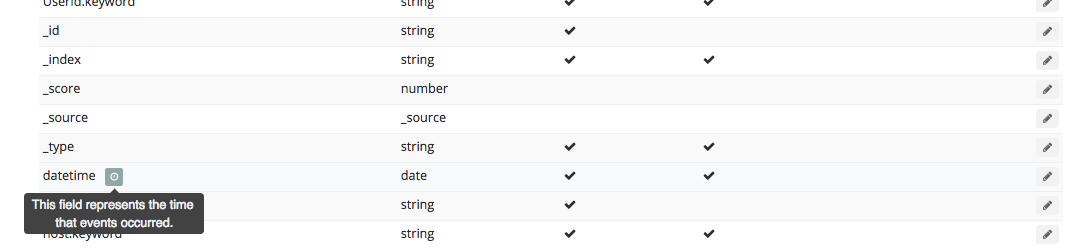
Now, under filter there's date which I've found to be a little tricky. Basically what we want to do is ignore the default @timestamp variable in Kibana which shows you when the data was loaded into Logstash, with the datetime feature we normalized earlier in this post. We need to match it exactly with how the datetime format is indicated in the CSV file, and admittedly this is sometimes a headache that leaves me rerunning this .config file several times until I get it right. Now, it's important to note that specifying the date format is VERY important. After reading every post on elastic.co and StackOverflow, I finally just experimented with changing the date format from YYYY-MM-dd HH:mm:ss to yyyy-MM-dd HH:mm:ss. And lo and behold, after five days of searching, this actually worked.
For mutate, this is where you indicate which of the 10 features need to be converted via convert into an integer or float. The documentation is here.
*Here's what I learned the hard way: Because reading in a CSV file will be read in default with a comma, converting the Id into an "integer" will lead to a comma: 15,646. Logstash reads this comma as another column, which was just ruining my life. Convert it to a "float" and this will not be a problem.
output tells the data to be connected via localhost. You need to specify what you want to call this index because this is how we'll configure it as an index pattern in Kibana. I named it "amazon", and each document (or you can think of this as a record), is a "review".
Loading the .config file
You'll want to save this .config file in a Text Editor like Sublime. Make sure that all the brackets and curly braces and other syntax is error-free. Too many times I've messed up on syntax and couldn't run the script!
Now load the file into logstash by inputting the following in the third Terminal tab:
cd /usr/local/Cellar/logstash/5.6.2

bin/logstash -f /Users/catherineordun/Documents/data/Kaggle/logstash_amazon.config
If successful, you'll see logstash loading up the 568,454 records like so:
Kibana Visualization
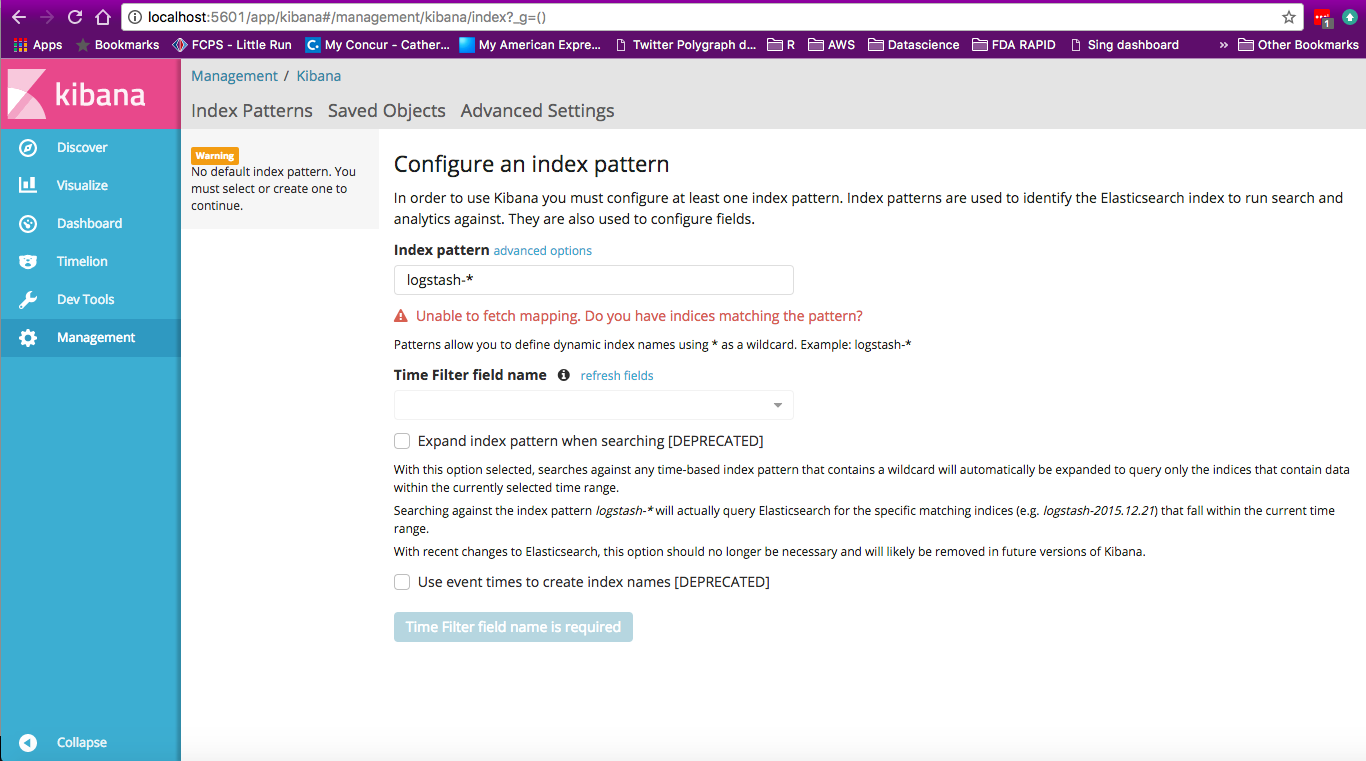
Go under ‘Dev Tools’ and you’ll find the Console. Type in GET _cat/indices (it’ll auto-suggest) to view all the indices that are loading. You’ll notice that as Logstash loads the Amazon config file, the number of records will increase over time. Next, go to the Management tab, and select a new index pattern by deleting logstash-*, and typing in amazon.
Now that we've loaded up our data in ElasticSearch, we should see a screen like this:
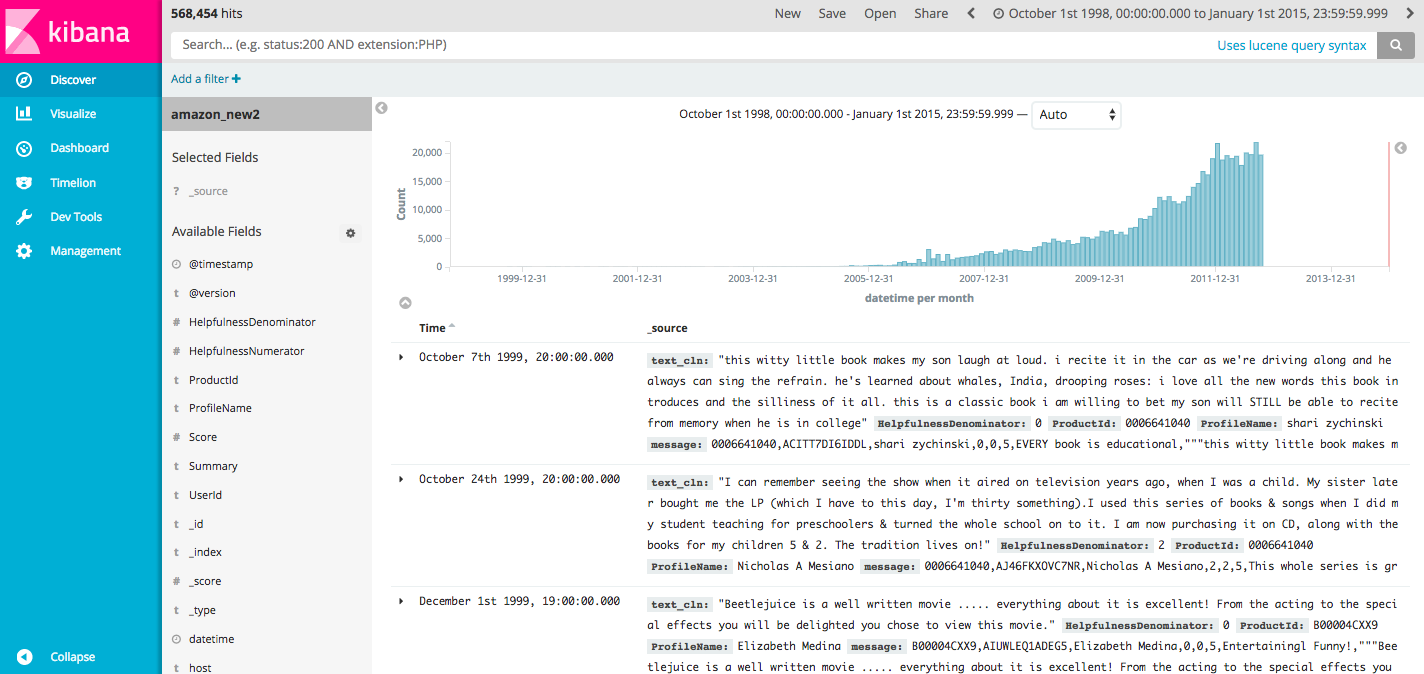
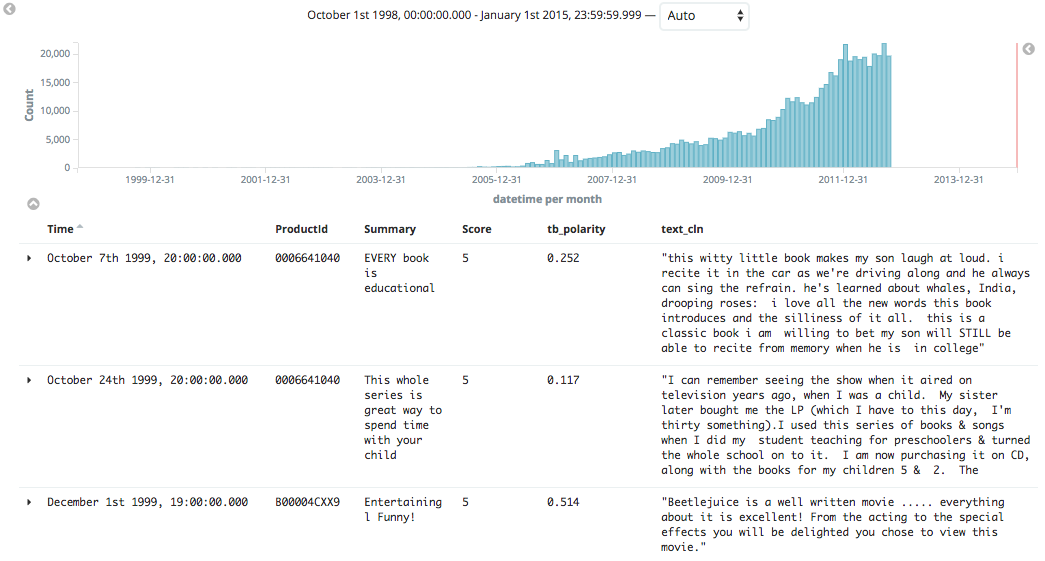
Now because I replaced the @timestamp with datetime, we have to search and set the time frame using the upper time filter thing, to a broad period that covers the dates when the reviews were stamped:
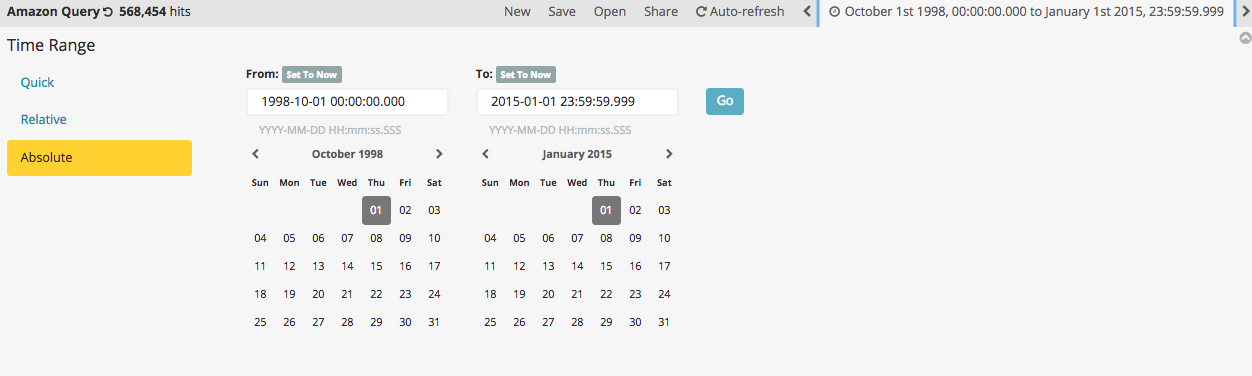
I set it to 1998-10-01 00:00:00.000 and 2015-01-01 23:59:59.999, which got me all 568,454 hits (records). Now with this, I selected on the right pane, the fields I wanted to add to the view. You can toggle the fields to the left and right as well as sort them once you add them. Here, I chose to add ProductID, Summary, Score, tb_polarity, and text_cln.
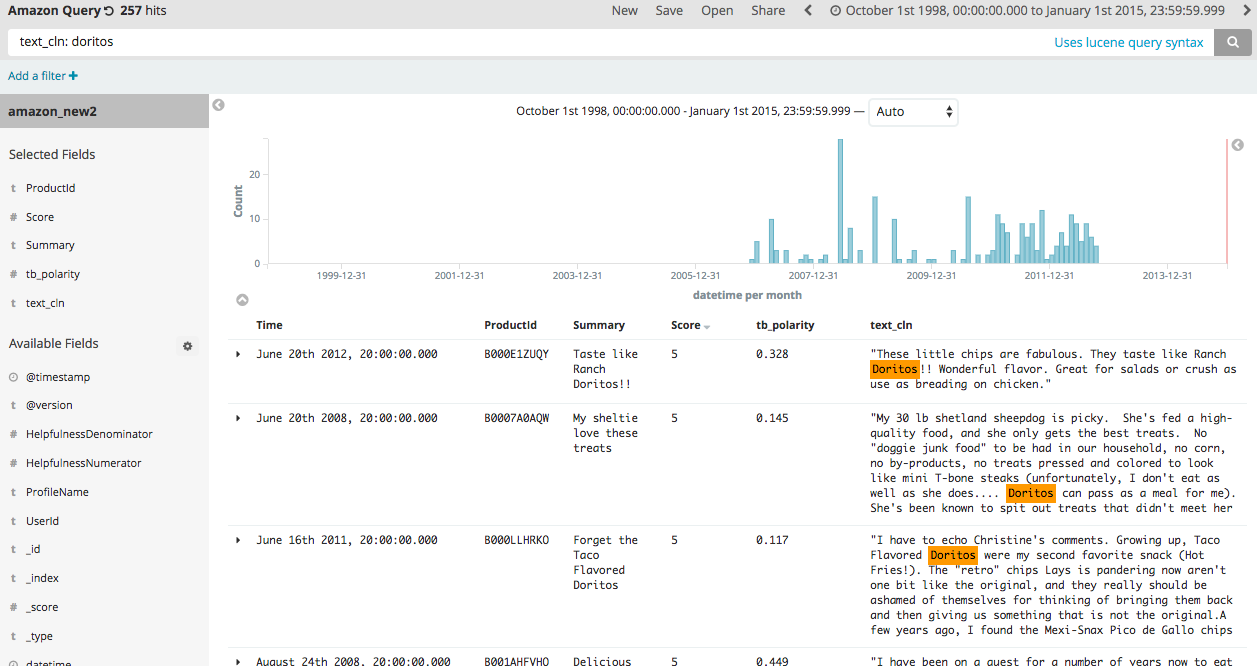
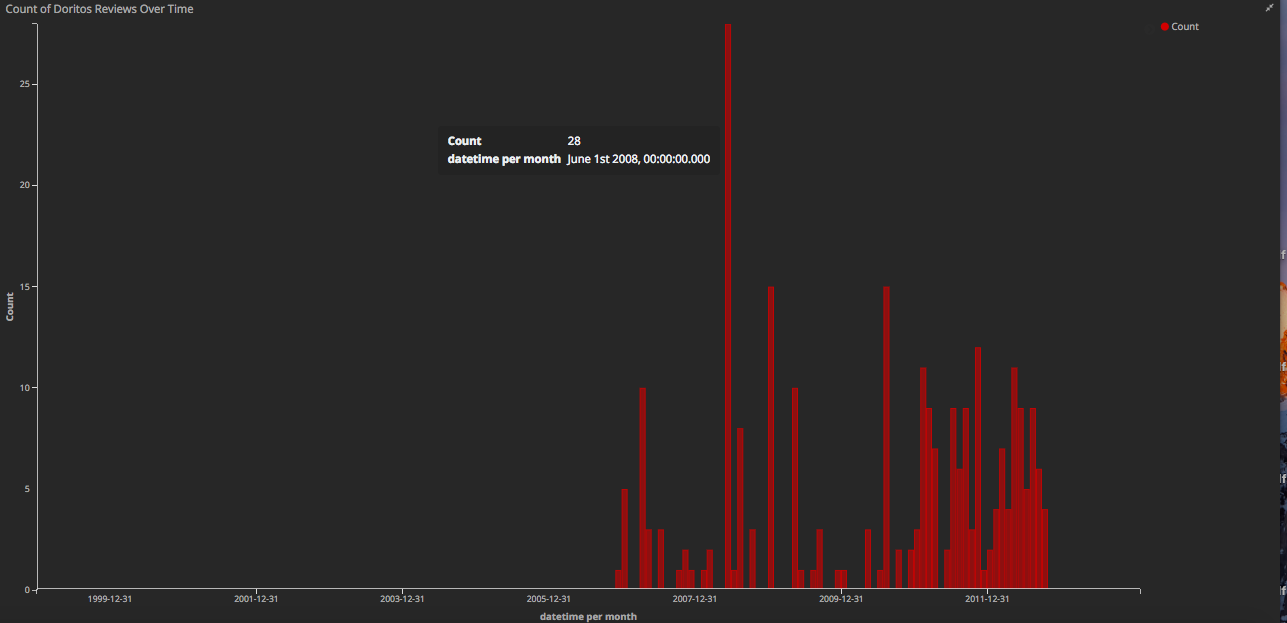
Now we can do cool things like count up and retrieve all the reviews mentioning Doritos:
Helpful Tips
Also, remember. If you mess up (and this may be my hard way), you’ll need to delete the existing index, especially if you’re likely keep the name of the index when you update the .config file. For example, I actually loaded up a logstash_amazon2.config (as opposed to logstash_amazon.config), but I didn’t change the index name. I left it as index => amazon. In that case, we need to make sure we delete the existing index, otherwise you’ll get double the number of records when you load Logstash next time.
Other helpful tips which may be obvious. If at any time you want to stop Logstash from loading the current index/config file, use control-c to terminate the operation.
Dashboard
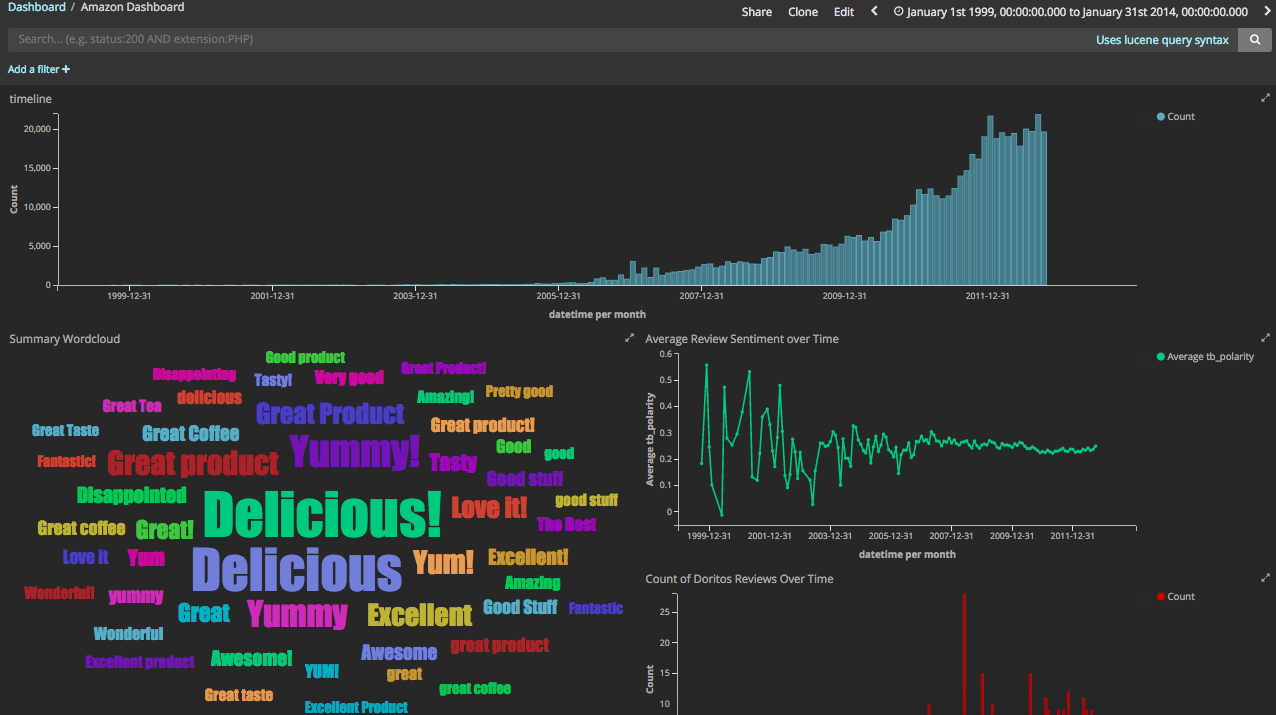
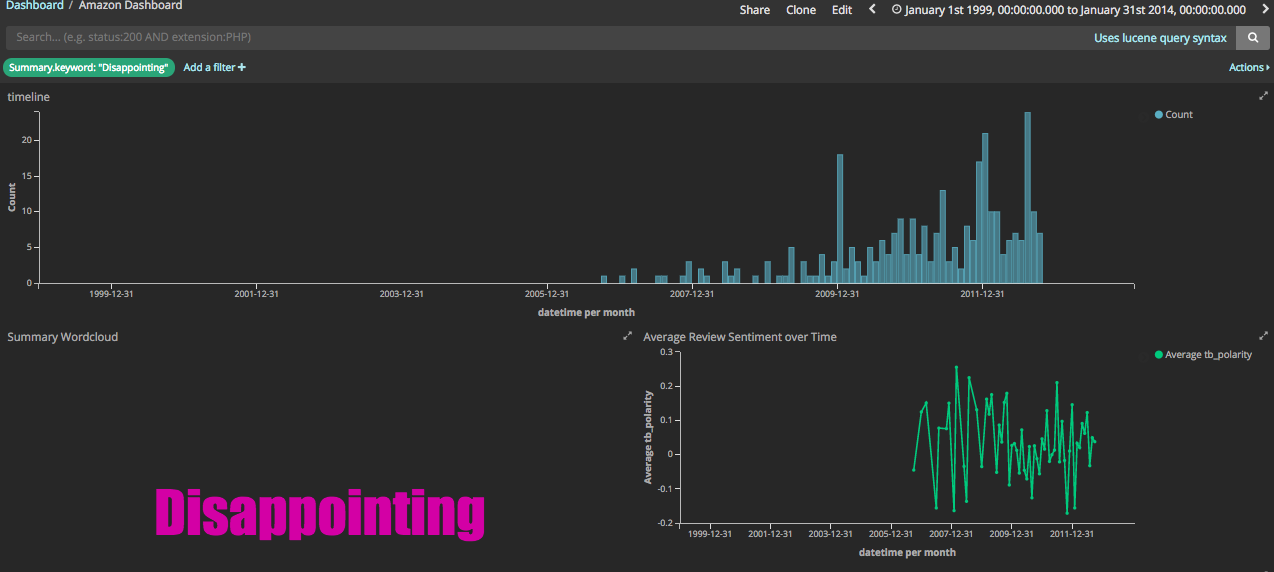
Now, we can create a series of visualizations using the Visualizations tab and add them to the Dashboard which is really simple to do.

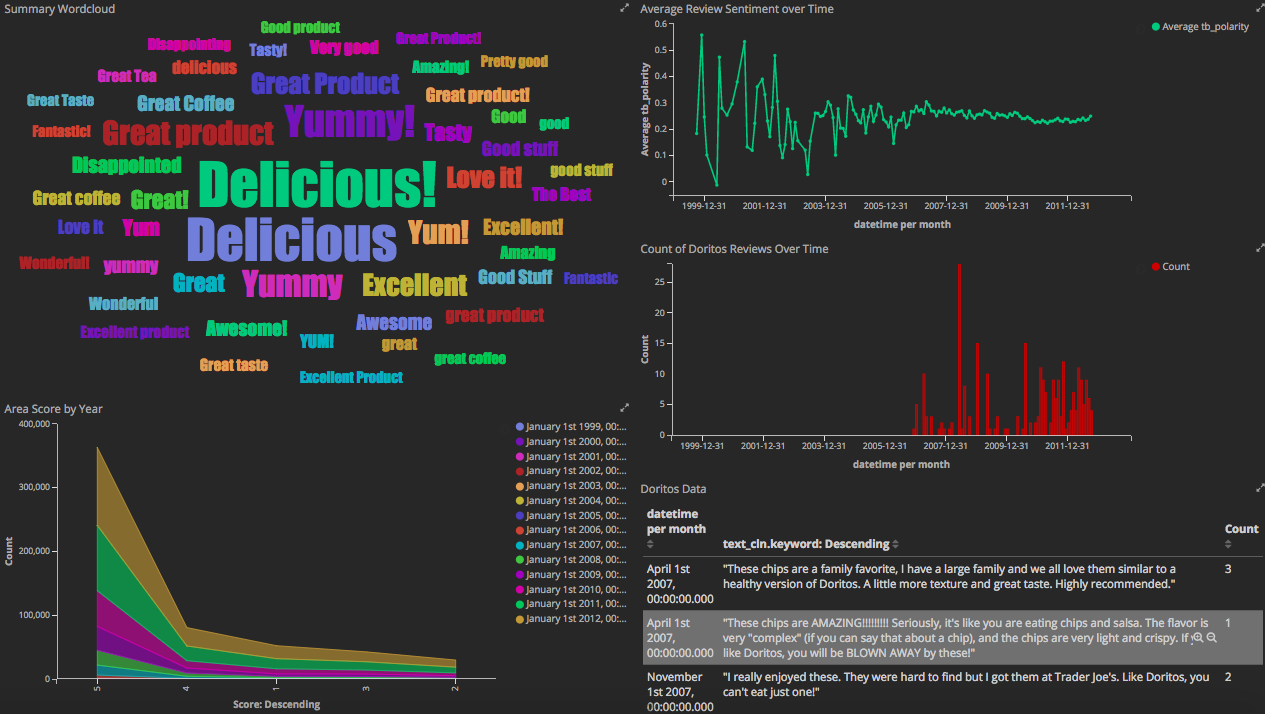
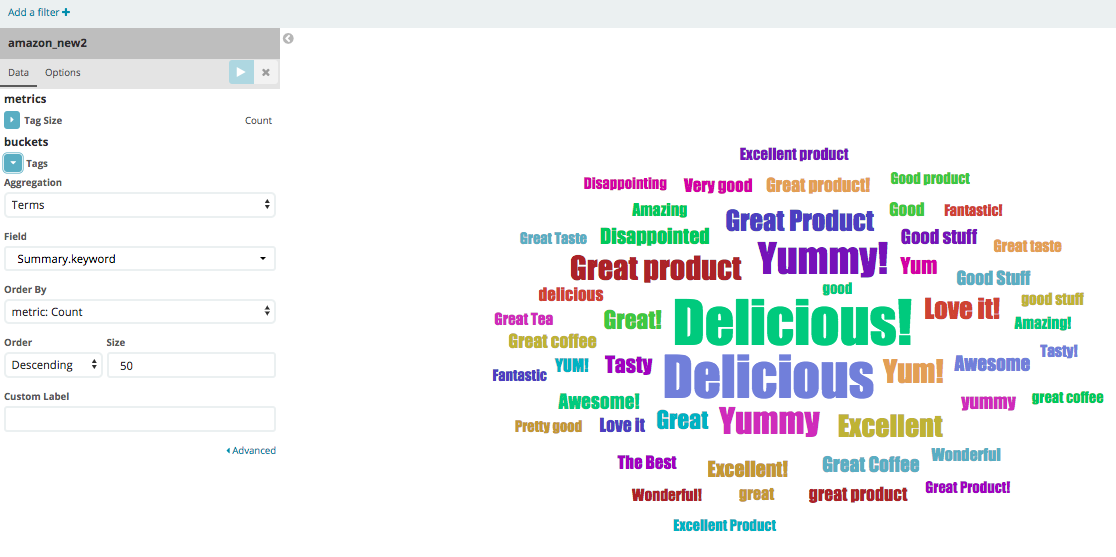
We have our timeline at the top showing all counts of records by time. To the bottom there's a wordcloud using the summary.keyword tag term. Like below:
And what's cool is that if you click on for example, "Disappointing", all the filters will update, giving you a sense of how many records over what time period and the average sentiment of the reviews
Going back to the Doritos example, there's a simple date histogram specifically filtered for text_cln is doritos, as well as a table of the reviews containing "doritos".
And at the very bottom, we have an area map filtered by the years, of the total number of reviews by the 5-star rating.
Conclusion
From what I understand, if you clone this dashboard, I can share the link with you and if you have ELK installed you can run it in Kibana. Email me if you'd like to get the dashboard. Thanks for reading, hope this was helpful.
Troubleshooting
Fatal Port Error on Logstash
Solution: kill an instance
May 21 2018. Ever since I installed the latest version of ELK 6.2, I started having some problems. I'll continue to update the below, but I wanted to add some troubleshooting tips along the way in case the ElasticSearch blogs didn't cover these.
FATAL Port 5601 is already in use. Another instance of Kibana may be running!
What to do?
C02V40QSHTDG:~ catherineordun$ ps -ef | grep kibana
501  7098     1   0  1:34PM ??         0:07.03
/usr/local/opt/kibana/bin/../libexec/node/bin/node --no-warnings
/usr/local/opt/kibana/bin/../src/cli

501  9185  9050   0  1:49PM ttys002    0:00.00 grep kibana

C02V40QSHTDG:~ catherineordun$ kill -9 7098

C02V40QSHTDG:~ catherineordun$ ps -ef | grep kibana
501  9189  9050   0  1:49PM ttys002    0:00.00 grep kibana

C02V40QSHTDG:~ catherineordun$ kibana

log   [17:50:02.917] [info][status][plugin:kibana@6.2.4] Status
changed from uninitialized to green - Ready
log   [17:50:02.956] [info][status][plugin:elasticsearch@6.2.4]
Status changed from uninitialized to yellow - Waiting for
Elasticsearch
log   [17:50:03.091] [info][status][plugin:timelion@6.2.4] Status
changed from uninitialized to green - Ready
log   [17:50:03.096] [info][status][plugin:console@6.2.4] Status
changed from uninitialized to green - Ready
log   [17:50:03.100] [info][status][plugin:metrics@6.2.4] Status
changed from uninitialized to green - Ready
log   [17:50:03.116] [info][listening] Server running at
 http://localhost:5601
log   [17:50:03.155] [error][status][plugin:elasticsearch@6.2.4]
Status changed from yellow to red - Your Kibana index is out of
date, reset it or use the X-Pack upgrade assistant.
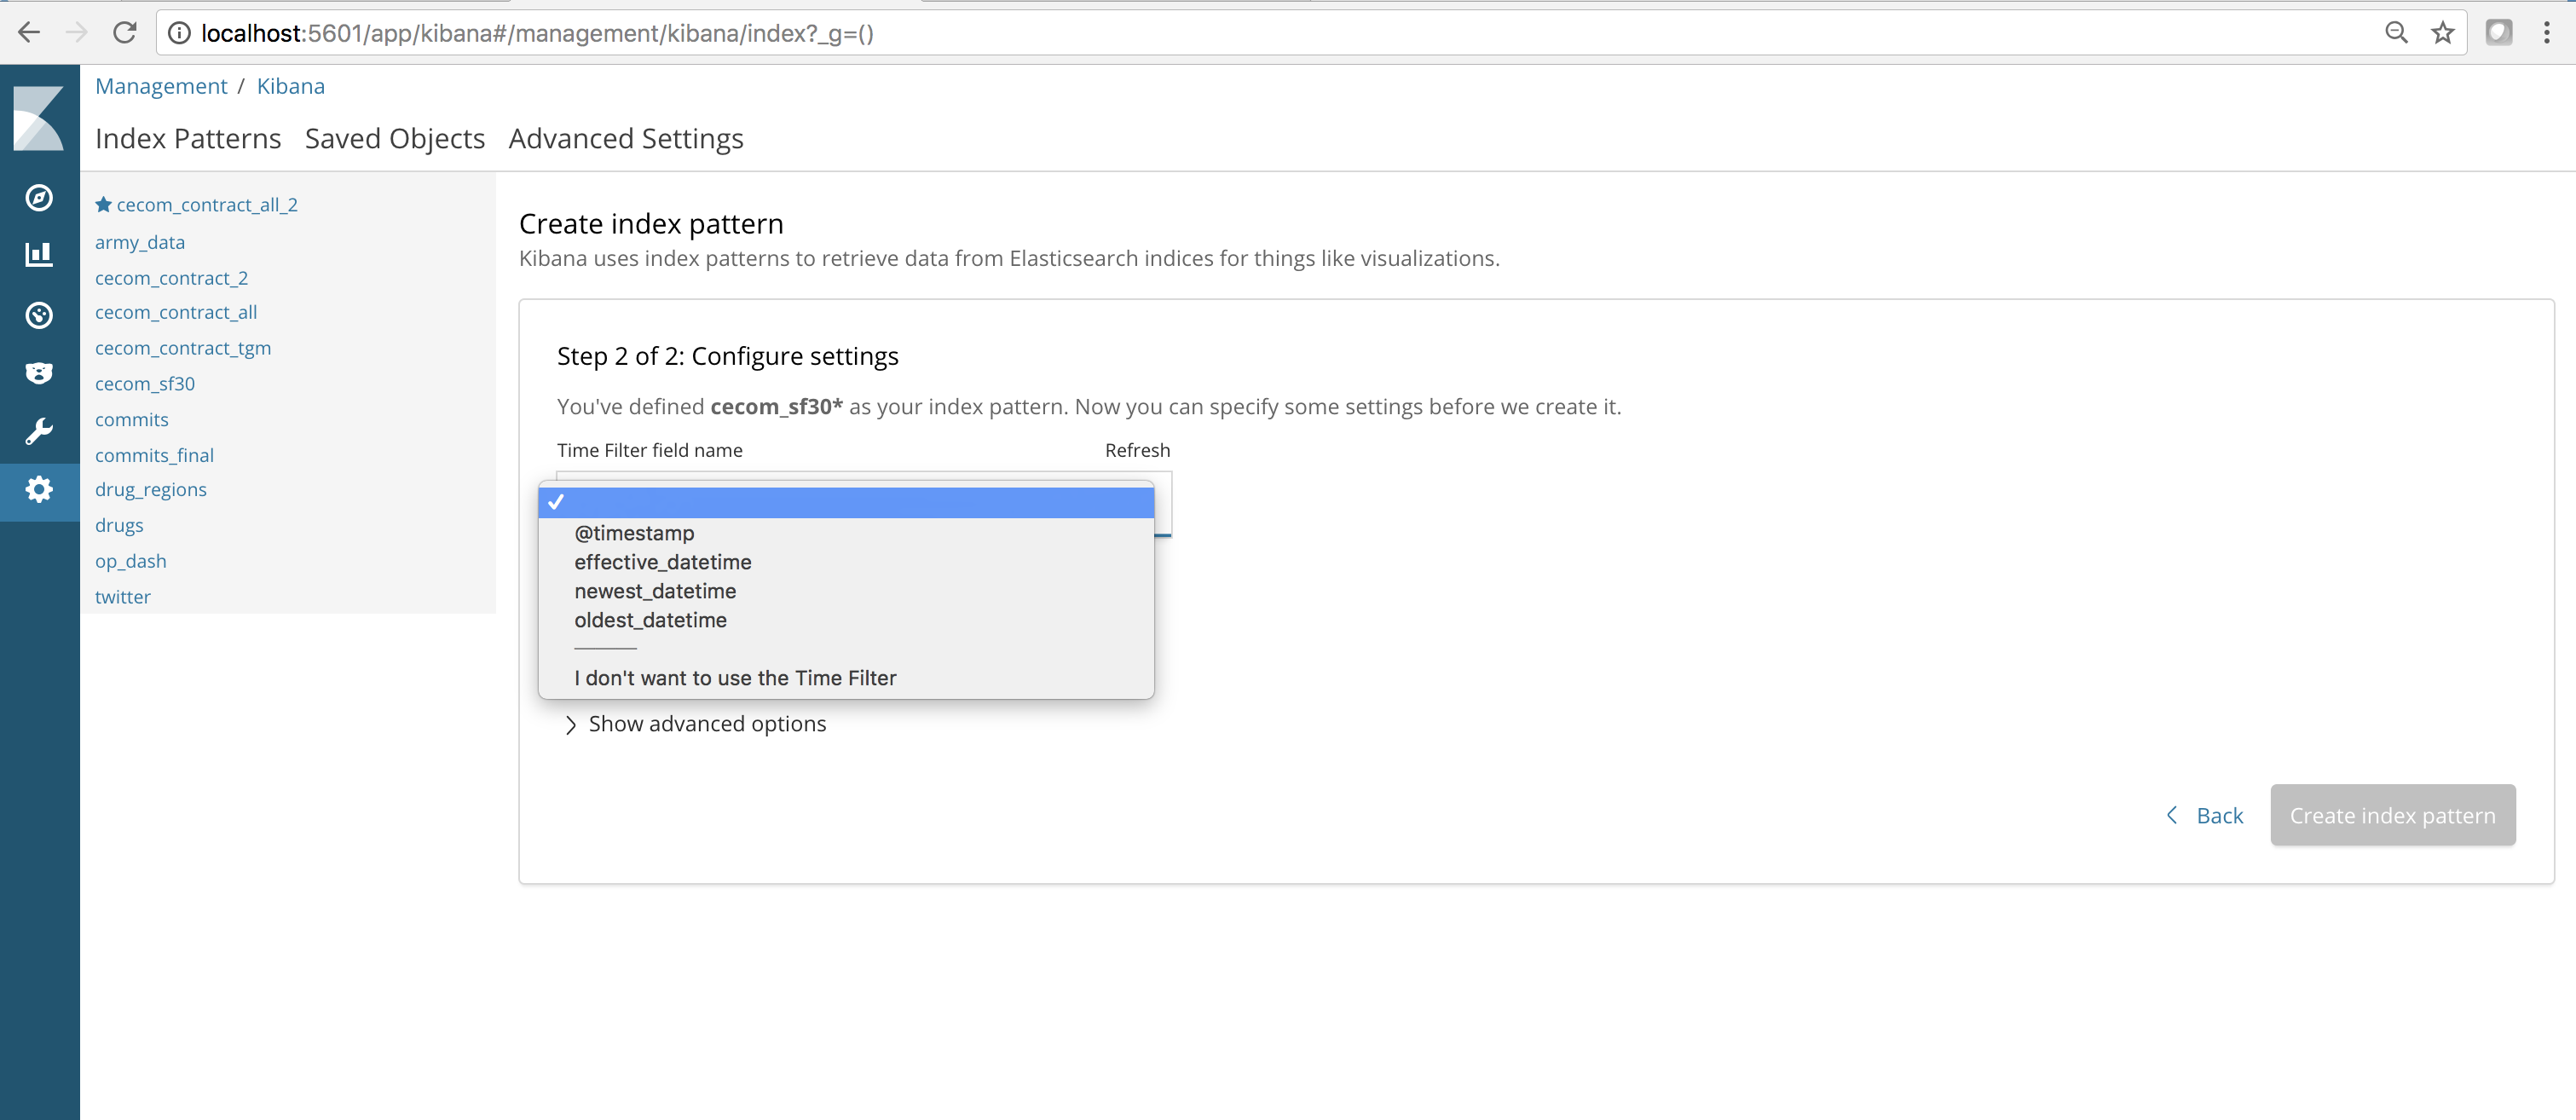
Parsing Multiple Strings into Multiple Dates
Solution: use multiple date{} filters
This one isn't so much a troubleshooting issue, as much as a trick I learned here: https://discuss.elastic.co/t/how-to-parse-multiple-date-fields/1208/2, and one that was really important for me.
filter {
   csv {
    separator => ","

    columns => ["Page",
    "Page_Type",
    "Effective_Date",
    "Document_Name",
    "cln_contents",
    "9char_strings",
    "dates",
    "oldest_date",
    "newest_date",
    "pop_days",
    "pseudo"]
   }

 date {
  match => ["Effective_Date", "MM/dd/YYYY"]
  target => "effective_datetime"
  }

date {
  match => ["oldest_date", "MM/dd/YYYY"]
  target => "oldest_datetime"
  }

date {
  match => ["newest_date", "MM/dd/YYYY"]
  target => "newest_datetime"
 }

mutate {
    convert => {
       "Page" => "integer"
       "pop_days" => "float"

    }
  }
}
You'll notice in the above that for each string Effective_Date, oldest_date, and newest_date, each need their own date{} filter. At first I bundled them altogether under one filter, which was a mistake. You need to parse them separately.
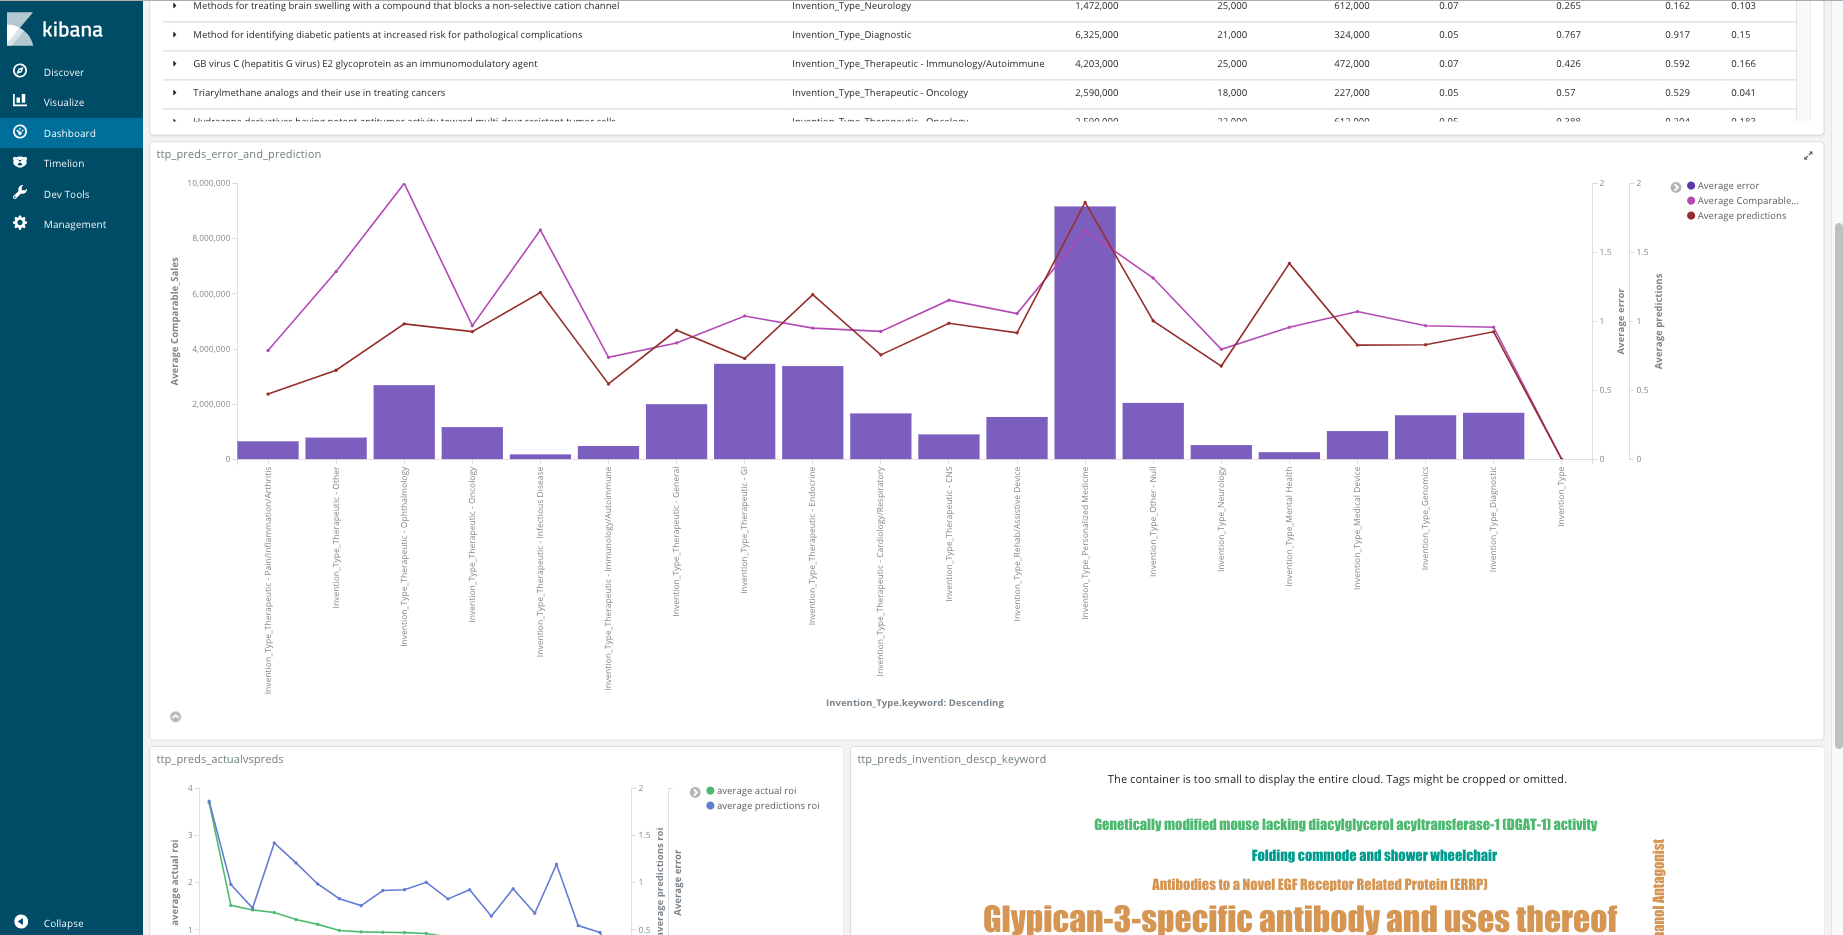
Screenshots of Additional Kibana Projects
Using fake data of patent records, I created a few additional `.config` files that used multiple dates, config syntax below: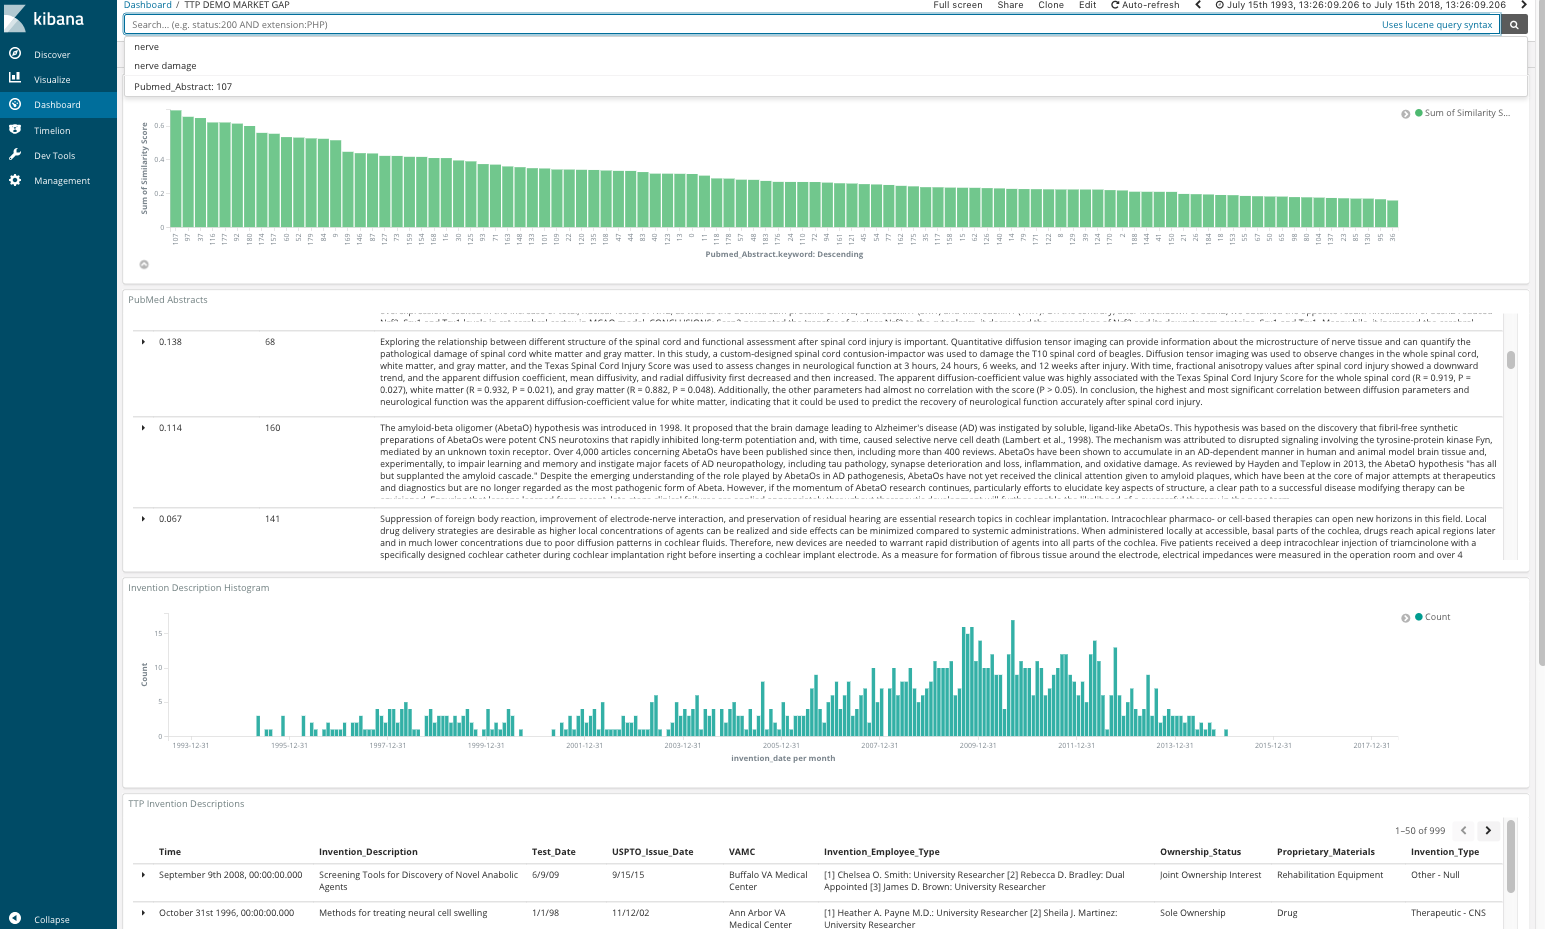
filter {
csv {
    separator => ","

    columns => [
    "Invention_Type",
    "VAMC",
    "Invention_Employee_Type",
    "Invention_Description",
    "Funding_Sources",
    "Ownership_Status",
    "Proprietary_Materials",
    "Invention_Date",
    "Test_Date",
    "USPTO_Issue_Date",
    "References"]
}
#For each date you want to convert into a timestamp, you need to write a separate date filter for it.
  date {
    match => ["Invention_Date", "MM/dd/YY"]
    target => "invention_date"
   }

 date {
    match => ["Test_Date", "MM/dd/YY"]
    target => "test_date"
  }

 date {
   match => ["USPTO_Issue_Date", "MM/dd/YY"]
   target => "uspto_date"
 }

}
As well as outputted results of a multilayer perceptron ROI model, also syntax below:
MLP code:
# define the model

model = Sequential()
#the number of features in your array, is 1031

model.add(Dense(1031, input_dim=1028, kernel_initializer='normal',
activation='relu')) #features is 1031
model.add(Dense(6, kernel_initializer='normal', activation='relu'))
model.add(Dense(1, kernel_initializer='normal'))

# Compile model
model.compile(loss='mean_squared_error', optimizer='adam')

#fit model
history = model.fit(X_train, y_train, validation_data=[X_test, y_test],
                epochs=100, batch_size=4)
As a tip, you sklearn's preprocessing.StandardScaler to scale your X and y values, as well as use inverse_transform to map them back to their original X values. The line graph above shows the absolute error value between the actual and predicted values.
#absolute value
test_values['error'] = abs(test_values['roi'] - test_values['predictions'])
test_values.sort_values(by='error')